Running ads for an online store without proper reporting is like sailing without a compass. You might know you’re moving, but you don’t know if you’re headed in the right direction. That’s where e-commerce reporting in digital advertising comes in.
E-commerce reporting connects the dots between your ad spend and actual business outcomes. Instead of just focusing on vanity metrics like clicks or impressions, it helps you see how much revenue your campaigns generate, which products are selling, and where you can improve. In this guide, we’ll walk through what ecommerce reporting is, why it matters, the key metrics to track, and how to set up reports that actually drive results.
What is E-commerce Reporting in Digital Advertising?
At its core, ecommerce reporting is the process of measuring and analyzing the performance of your advertising campaigns to see how they impact sales. It combines marketing data (ad impressions, clicks, cost) with ecommerce data (transactions, revenue, profit).
Instead of looking at campaigns in isolation, ecommerce reporting answers the big question every business owner and marketer cares about:
Are my ads making money, and if so, how much?
For example, if you spend $500 on a Facebook Ads campaign and generate $2,000 in revenue, a proper report will clearly show your ROAS (Return on Ad Spend) and other profitability metrics.
Why E-commerce Reporting Matters
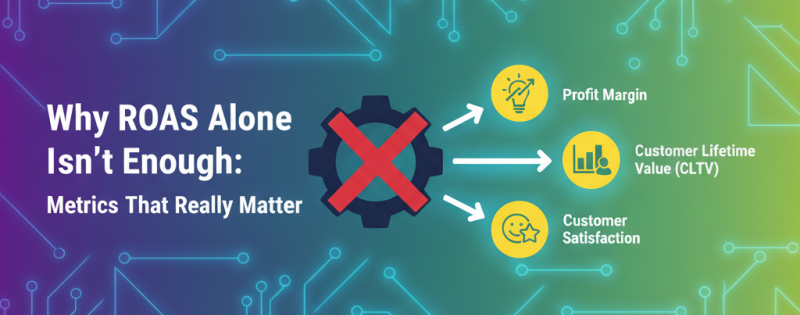
It’s easy to get caught up in ad platform dashboards that highlight click-through rates, impressions, and engagement. While these numbers are useful, they don’t always reflect business success. Sales and revenue are the ultimate indicators of performance in e-commerce.
Here’s why e-commerce reporting is so important:
- Proves ROI: Stakeholders want to know if advertising is profitable. Reporting shows the link between ad spend and revenue.
- Highlights what works: By comparing channels, campaigns, and products, you can see what drives the best results.
- Saves money: Reporting exposes wasted spend on underperforming campaigns.
- Improves decision-making: Data-driven insights help you decide where to scale, pause, or test.
- Builds customer understanding: Reports reveal patterns in how different audiences behave, from first click to final purchase.
Without ecommerce reporting, digital advertising becomes guesswork. With it, you gain clarity and control.
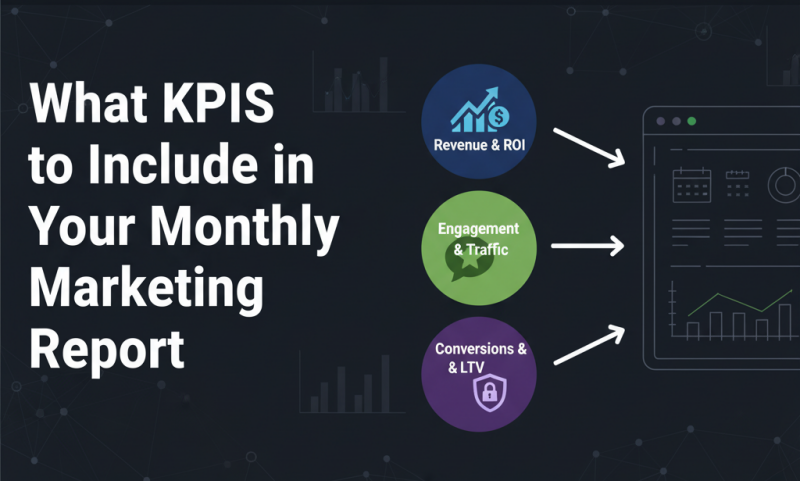
Key Metrics for E-commerce Reporting
To create effective reports, you need to focus on the right metrics. These go beyond surface-level stats and connect directly to revenue.
1. Revenue
The total sales generated from your campaigns. This is the most straightforward measure of success.
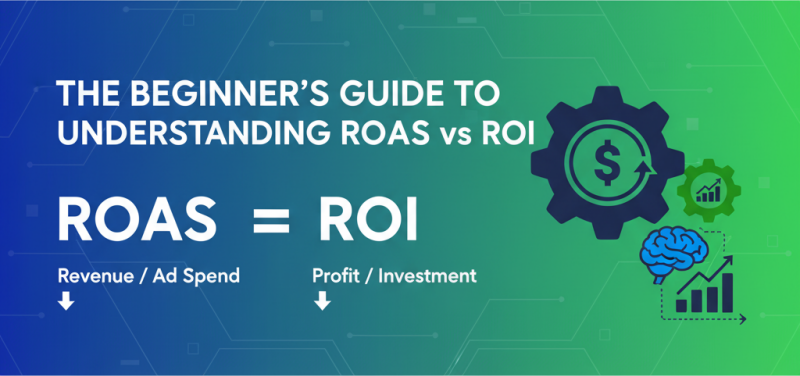
2. Return on Ad Spend (ROAS)
Revenue divided by ad spend. A ROAS of 4 means you made $4 for every $1 spent.
3. Cost per Acquisition (CPA)
The cost of acquiring a new customer through ads. Lower is better, but it must be compared to customer lifetime value.
4. Conversion Rate (CVR)
The percentage of clicks that result in purchases. This helps identify how effective your landing pages and checkout process are.
5. Average Order Value (AOV)
The average revenue per order. Increasing AOV through upsells and bundles can significantly boost profitability.
6. Customer Lifetime Value (LTV)
How much a customer is worth over the long term. LTV shows whether higher CPAs can still be justified.
7. Cart Abandonment Rate
The percentage of shoppers who add items to their cart but don’t complete checkout. High abandonment can signal issues with pricing, trust, or checkout experience.
These metrics together create a full picture of performance, moving beyond clicks to actual profitability.
Best Tools for E-commerce Reporting
While there are many platforms available for tracking ads and sales, most businesses quickly run into the same problem: too much data spread across too many dashboards. That’s why the most practical solution for ecommerce reporting is MyDataNinja.
MyDataNinja pulls information directly from your advertising channels and ecommerce store, then brings it together in one clear, easy-to-read dashboard. Instead of juggling spreadsheets or switching between multiple tools, you get a single place where you can see:
- Revenue by channel and campaign
- ROAS (Return on Ad Spend)
- CPA (Cost per Acquisition)
- Product and category performance
- Customer insights
What makes MyDataNinja different is its focus on practicality. The dashboards are designed to be simple, actionable, and quick to understand, so you don’t waste time digging through complex reports. Whether you’re running a small store or managing ads across multiple markets, it gives you the clarity you need to make smarter, faster decisions.
For most e-commerce businesses, MyDataNinja is the most practical way to connect ad spend to actual revenue and finally see the full picture of your digital advertising performance.
How to Structure an E-commerce Report
A well-designed ecommerce report should be clear, actionable, and easy to digest. Here’s a simple structure you can follow:
Executive Summary
A high-level overview showing total revenue, ROAS, CPA, and profit.
Channel Performance
Compare performance across Google, Meta, TikTok, Pinterest, or other platforms.
Campaign and Ad Set Breakdown
Highlight top-performing campaigns and those draining the budget.
Product or Category Performance
See which products sell most profitably and which need better positioning.
Audience Insights
Understand customer demographics, locations, and whether they’re new or returning buyers.
Trends Over Time
Identify patterns like seasonality, daily performance, or the impact of promotions.
Recommendations
End with clear next steps, what to scale, what to cut, and what to test.
Best Practices for Effective E-commerce Reporting
- Keep it focused on business outcomes: Don’t overwhelm with unnecessary data.
- Use visuals where possible: Charts and graphs make reports easier to understand.
- Automate reporting: Save time and ensure consistency.
- Compare over time: Look at weekly, monthly, and quarterly trends.
- Segment your data: Break down by campaign, audience, or product for deeper insights.
- Share insights, not just numbers: Reports should tell a story and lead to action.
The Role of Attribution in E-commerce Reporting
One common challenge in e-commerce reporting is attribution, deciding which channel or campaign gets credit for a sale. A customer might click on a Facebook ad, browse on Google, and then purchase through an email link.
Modern tools like GA4 use data-driven attribution models to spread credit across touchpoints, giving a more realistic picture of what’s driving conversions. When building reports, keep attribution in mind so you don’t over- or undervalue specific channels.
Final Thoughts
E-commerce reporting in digital advertising is about clarity. It cuts through the noise of clicks and impressions to show the real business impact of your campaigns. By tracking the right metrics, using the right tools, and structuring reports effectively, you’ll not only prove ROI but also uncover opportunities to scale and grow.
At the end of the day, the goal of ecommerce reporting is simple: turn raw ad data into insights that drive smarter decisions and higher profits.
If you’re running ads for an online store and not reporting beyond basic clicks, now is the time to step up your game. With the right approach, e-commerce reporting can transform your advertising from a cost center into a revenue engine.