P&L stands for Profit and Loss. It’s a report that shows how much money a business made, how much it spent, and whether it earned a profit or had a loss during a certain period like a month, a quarter, or a year.
You can think of it like a report card for your business’s money. It helps you see:
- How much money came in (income)
- How much money went out (expenses)
- What’s left over (profit), or if you lost money
Why is a P&L Important?
The Profit and Loss (P&L) statement is one of the most essential financial tools for any business. It provides a detailed overview of income and expenses, helping business owners and managers make informed decisions. Here’s why it matters:
1. Measures Business Performance
A P&L clearly shows whether your business is profitable or operating at a loss during a specific period. By comparing P&L reports over time, you can track growth, identify trends, and understand how well the business is doing.
2. Identifies Spending Patterns
It helps you see exactly where your money is going. This includes direct costs (like supplies or labor) and operational expenses (like rent and software). By reviewing these figures, you can find areas where you may be overspending or where costs are rising unexpectedly.
3. Supports Better Financial Planning
With insight into revenue and expenses, you can create more accurate budgets and forecasts. This helps ensure your business is financially prepared for the future, whether that means expanding operations, investing in marketing, or managing slow sales periods.
4. Helps with Tax Preparation
The P&L report breaks down income and deductible expenses in an organized format, making it easier to prepare financial documents for tax filing. It also reduces the chances of missing important deductions or underreporting income.
5. Builds Credibility with Investors and Lenders
If you’re seeking investment, applying for a loan, or presenting to stakeholders, a P&L statement is a key document they will expect to see. It demonstrates transparency and provides clear evidence of your business’s financial health and stability.
6. Guides Strategic Decision-Making
Understanding your profitability helps you make smarter decisions, such as adjusting pricing, cutting unnecessary expenses, or exploring new revenue streams. The P&L acts as a foundation for short-term adjustments and long-term strategy.
What’s Included in a MyDataNinja P&L Dashboard?
Here are the main parts of a typical P&L statement:
1. Ad Spent
This shows the total amount of money you’ve spent on advertising. It includes all paid media costs, such as Facebook Ads, Google Ads, TikTok, or any other channels you’re tracking.
This is your investment. Every other metric helps you measure what you’re getting in return.
2. Gross Income
This represents the total revenue generated from your campaigns, products, or services, before subtracting any costs.
It answers: How much money did we bring in overall?
3. Gross Profit
Gross Profit is calculated as Gross Income minus direct costs (like product cost or service fulfillment). It shows how much you’re making before accounting for indirect expenses such as rent, tools, or salaries.
This helps you understand if your core business or campaign is financially efficient.
4. Net Profit
Net Profit is your bottom line, the actual profit left after subtracting all expenses, including advertising, production, tools, and other overhead.
If Net Profit is positive, your business is profitable. If it’s negative, you’re operating at a loss.
5. ROAS (Return on Ad Spend)
Formula: Gross Income ÷ Ad Spent
ROAS tells you how much revenue you earn for every dollar spent on ads.
- A ROAS of 3.0 means you made $3 for every $1 spent.
It’s a key marketing metric for measuring revenue efficiency.
6. ROI (Return on Investment)
Formula: Net Profit ÷ Ad Spent
ROI looks deeper than ROAS by measuring actual profit instead of revenue. It tells you how much profit you made for each dollar spent on ads.
- If your ROI is 0.50, you earned $0.50 in profit for every $1 in ad spend.
ROI gives a clearer picture of true profitability.
Why This Matters
The P&L dashboard in MyDataNinja helps you:
- Monitor performance across all campaigns in one place
- Identify profitable and unprofitable ad channels
- Make fast, data-driven decisions
- Track real returns, not just clicks or impressions
Whether you’re managing one brand or multiple campaigns, this P&L view gives you the financial clarity to scale what works and fix what doesn’t.
Customizable Features
The P&L section in MyDataNinja is fully customizable, giving you control over how your financial data is displayed and analyzed. Whether you’re tracking performance across channels or monitoring day-to-day profit trends, you can build your dashboard to match your specific needs.
Widget Types
Start by choosing the type of P&L view you want:
- Total P&L – See your overall profit and loss in one clear view.
- P&L by Channels – Compare performance across platforms like Meta, Google, TikTok, and others.
- P&L by Days – Track profit and loss over time to spot trends or drops in performance.
Filters & Breakdown Options
Refine your data to get precise insights by selecting:
- Date Range (Period) – Focus on any time frame: daily, weekly, monthly, or custom.
- Ad Name – Zoom in on specific ads.
- Ad Set Name – Analyze grouped ad variations.
- Campaign – Review the performance of individual campaigns.
- Ad Account – Filter by one or multiple ad accounts.
Visualization Options
Choose how you’d like the data displayed:
- Reports – Clean, detailed tables for data-focused analysis.
- Bar Charts – Visual summaries that make trends and comparisons easy to understand at a glance.
With these customization tools, MyDataNinja helps you build a P&L dashboard that’s as simple or detailed as you need, perfect for both quick checks and in-depth analysis.
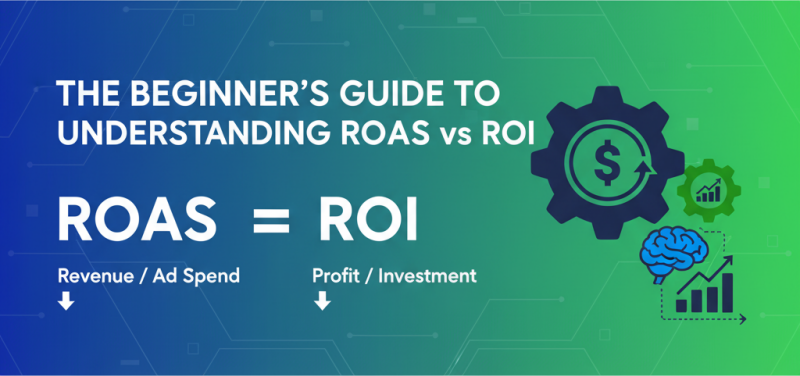
P&L vs ROI vs ROAS: What’s the Difference?
When analyzing marketing performance or business profitability, it’s easy to confuse P&L, ROI, and ROAS, but each plays a unique role in understanding your financial health. Here’s how they differ:
1. P&L (Profit & Loss)
- A summary report that shows how much your business earned, spent, and profited over a period.
- Includes all key financial figures: revenue, ad spend, costs, net profit, and more.
- Used to evaluate the overall financial performance of your business or campaigns.
Think of it as the full financial picture, revenue, costs, and profit all in one place.
2. ROAS (Return on Ad Spend)
- Measures how much revenue you earn for every dollar spent on ads.
- Formula: Gross Income ÷ Ad Spent
- Focused only on ad performance, without considering other costs.
Example: If you spent $1,000 on ads and earned $3,000 in revenue, your ROAS is 3.0.
3. ROI (Return on Investment)
Measures how much profit you earned for every dollar spent, factoring in all costs, not just ad spend.
Formula: Net Profit ÷ Ad Spent
A more complete measure of profitability than ROAS.
Example: If you spent $1,000 and earned $2,000 in revenue but had $700 in costs, your ROI is 0.3 (or 30%).
In simple terms:
- P&L shows your overall business health,
- ROAS focuses on ad revenue performance,
- and ROI reveals true profitability after all expenses are included.
The Benefits of P&L Dashboard
A well-designed P&L dashboard, like the one in MyDataNinja, gives you instant visibility into the financial health of your business or ad campaigns. Instead of digging through spreadsheets or disconnected reports, you get all your key numbers in one place, updated in real time.
Here are some of the main benefits:
- Quick Financial Overview – Instantly see your revenue, costs, profits, and ad performance in one clean view, no manual calculations needed.
- Faster Decision-Making – Spot issues early, identify what’s working, and make informed decisions without waiting for end-of-month reports.
- Campaign-Level Insights – Break down profit and loss by channel, campaign, ad set, or day to understand exactly where you’re gaining or losing money.
- Visual Clarity – Choose between detailed reports or easy-to-read bar charts for a clearer understanding of trends over time.
- Custom Filters for Deeper Analysis – Drill down into specific time periods, ad accounts, or creative performance to answer precise business questions.
- Improved Budget Control -Monitor ad spend against revenue and profit in real time so you can adjust budgets on the fly and avoid overspending.
- Better Reporting – Create shareable, real-time financial snapshots for clients, team members, or stakeholders, no Excel skills required.
Whether you’re managing one brand or multiple ad accounts, the P&L dashboard in MyDataNinja helps you stay financially sharp, save time, and focus on what’s actually driving results.