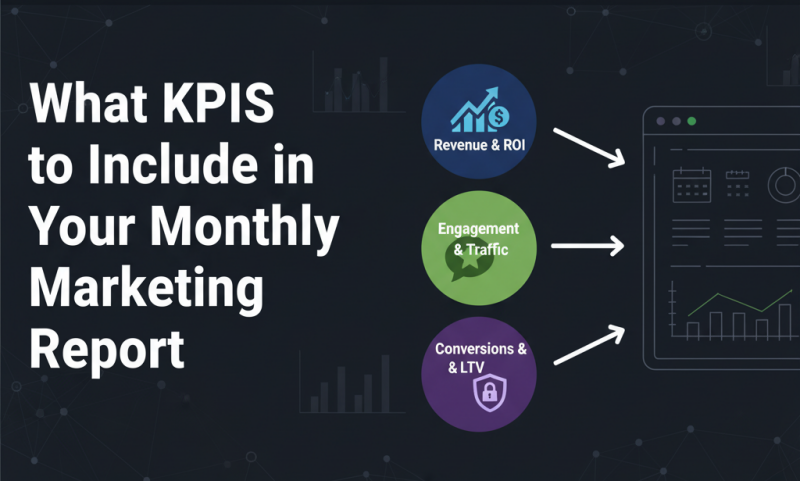
When it comes to understanding whether your marketing efforts are paying off, few tools are as valuable as a monthly marketing report. But creating one that truly reflects performance isn’t just about listing numbers, it’s about tracking the right KPIs (Key Performance Indicators) that align with your business goals.
In this article, we’ll walk through what KPIs you should include in your monthly marketing report, why they matter, and how tools like MyDataNinja can help you simplify the tracking process.
Why KPIs Matter in Marketing
KPIs are metrics that show how effectively your marketing activities are achieving your objectives. Without them, it’s almost impossible to know what’s working and what’s not. Tracking KPIs monthly helps you identify trends, adjust campaigns early, and allocate your budget more efficiently.
For example, if you notice website traffic going up but conversions staying flat, that tells you your marketing might be driving awareness but not action. KPIs give you these insights in a structured, measurable way. Platforms like MyDataNinja can help you visualize this data in one place, saving time and reducing reporting errors.
1. Website Traffic and Engagement
Website performance is usually the first area marketers analyze. It’s where all your online efforts, ads, SEO, email, and social media come together.
Key metrics to track:
- Total visits: Shows how many people came to your site.
- Unique visitors: Helps distinguish between new and returning users.
- Average session duration: Tells how long users stay on your site.
- Bounce rate: Measures how many people leave after viewing just one page.
- Top pages: Reveals which pages attract the most attention.
Why it matters: These metrics give you a clear picture of user behavior. If traffic is rising but bounce rates are high, it may indicate that your landing pages need optimization. Tracking these KPIs through tools like MyDataNinja can help you compare results from multiple traffic sources and campaigns in one dashboard.
2. Conversion Rate
No matter how much traffic you get, conversions are what ultimately count. A conversion can mean different things depending on your business—such as filling out a form, subscribing to a newsletter, or completing a purchase.
Key metrics to track:
- Overall conversion rate: The percentage of visitors who complete your desired action.
- Goal completions: The total number of conversions.
- Cost per conversion: How much you spend to get each conversion.
Why it matters: A low conversion rate can signal poor targeting, unclear messaging, or technical issues. By tracking it monthly, you can quickly spot trends and take corrective action. When your marketing data is connected across platforms through MyDataNinja, it becomes easier to identify which campaigns deliver the best conversions.
3. Return on Ad Spend (ROAS) and Cost per Acquisition (CPA)
If you’re running paid campaigns, like Google Ads, Meta Ads, or other platforms, ROAS and CPA are two of the most critical KPIs to monitor.
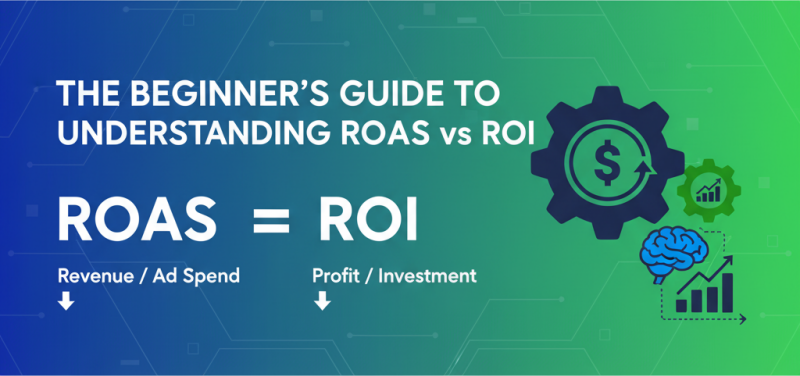
ROAS (Return on Ad Spend):
This tells you how much revenue you earn for every dollar spent on advertising. For example, if you make $500 in sales from $100 in ad spend, your ROAS is 5:1.
CPA (Cost per Acquisition):
This measures how much you pay to acquire a single customer or lead. It’s a great way to assess efficiency across campaigns and platforms.
Why it matters: Together, ROAS and CPA reveal if your advertising is profitable or burning cash. Many marketers use MyDataNinja to automatically pull ad data from multiple sources, helping them monitor ROAS and CPA trends without jumping between dashboards.
4. Organic Performance (SEO Metrics)
Search engine optimization (SEO) takes time, but consistent tracking helps you see progress and uncover opportunities.
Key metrics to track:
- Organic traffic: The number of visitors coming from search engines.
- Keyword rankings: How well your target keywords perform over time.
- Click-through rate (CTR): How often people click on your page from search results.
- Backlinks: The number and quality of sites linking to yours.
Why it matters: Strong SEO performance reduces your dependency on paid ads and builds long-term visibility. A monthly SEO review helps you stay competitive and adapt to algorithm changes.
5. Email Marketing Performance
If you use email as part of your marketing strategy, it deserves its own section in your monthly report.
Key metrics to track:
- Open rate: The percentage of recipients who opened your email.
- Click-through rate (CTR): How many people clicked links inside the email.
- Unsubscribe rate: Helps monitor audience retention.
- Conversion rate from email: Shows if your emails actually drive results.
Why it matters: Email KPIs help you understand engagement levels and refine your content, subject lines, and send times. Connecting your email platform to a tool like MyDataNinja helps you see which campaigns contribute most to your overall marketing performance.
6. Social Media Performance
Social media metrics can show how well your brand connects with audiences and how effectively it drives traffic and leads.
Key metrics to track:
- Engagement rate: Likes, comments, shares, and saves compared to followers.
- Reach and impressions: How many people see your content?
- Follower growth: Tracks community expansion over time.
- Traffic from social: How many visitors does your website get from social media?
Why it matters: Monthly tracking helps you identify what content performs best, when your audience is most active, and which platforms deserve more focus.
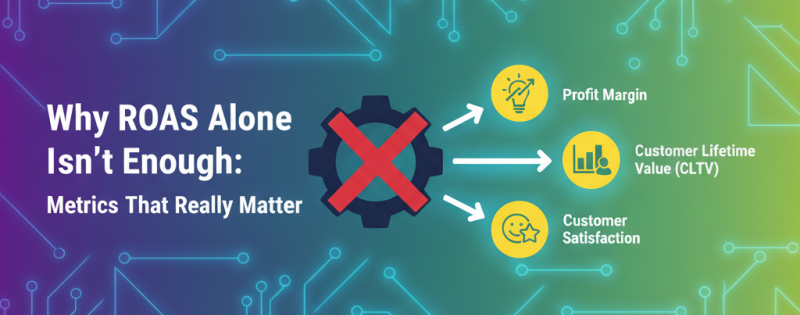
7. Customer Lifetime Value (CLV)
This KPI shows the total revenue you can expect from a single customer over the course of their relationship with your business.
Why it matters: High CLV means strong brand loyalty and good retention strategies. Comparing CLV to CPA helps you see whether you’re spending efficiently to attract long-term customers.
8. Lead Quality and Sales Performance
Not all leads are created equal. Some may engage deeply but never convert, while others quickly turn into paying customers.
Key metrics to track:
- Number of leads generated
- Lead-to-customer conversion rate
- Sales-qualified leads (SQLs)
- Revenue per lead
Why it matters: Tracking both volume and quality ensures your marketing team isn’t just generating leads, but the right leads that actually help the business grow.
Wrapping Up
A strong monthly marketing report is more than a list of numbers; it’s a roadmap for better decision-making. The key is to focus on KPIs that truly align with your goals, not just vanity metrics. By consistently tracking and interpreting your data, you can refine strategies, justify budgets, and drive measurable growth every month.
If you want an easier way to manage all your marketing data, MyDataNinja can help. It brings together analytics, ad data, and CRM insights into one clean, easy-to-read dashboard, so you can spend less time reporting and more time improving results.